
Understand your market. Build reports your clients will value.
Closing Data Research provides the local sales data, charts, maps, and reporting tools you need to follow the market and communicate it clearly. Explore current activity, identify meaningful trends, and build polished client reports directly in the platform.
- Access current local sales and market data
- Explore trends by area, price range, and property type
- Build client-ready reports using the platform’s charts and data
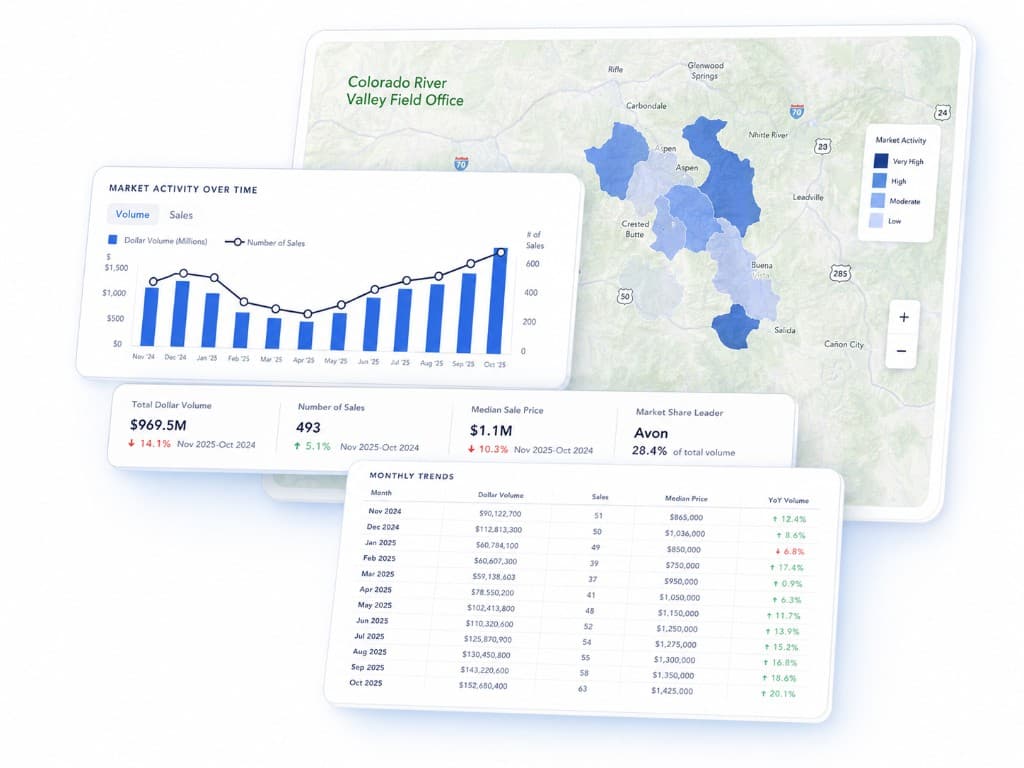
Market data included
Access organized local sales and property data without sourcing and preparing it yourself.
Detailed local analysis
Move from regional performance into the communities, price ranges, and property types shaping the market.
Charts built from the data
Turn the platform’s market data into clear charts, comparisons, maps, and tables.
Flexible report builder
Select the charts and market data that matter, arrange them into a report, and create a polished update for your clients.
Everything you need to understand and report on your market
Closing Data Research brings reliable local market data, interactive analysis, and client reporting together in one platform.
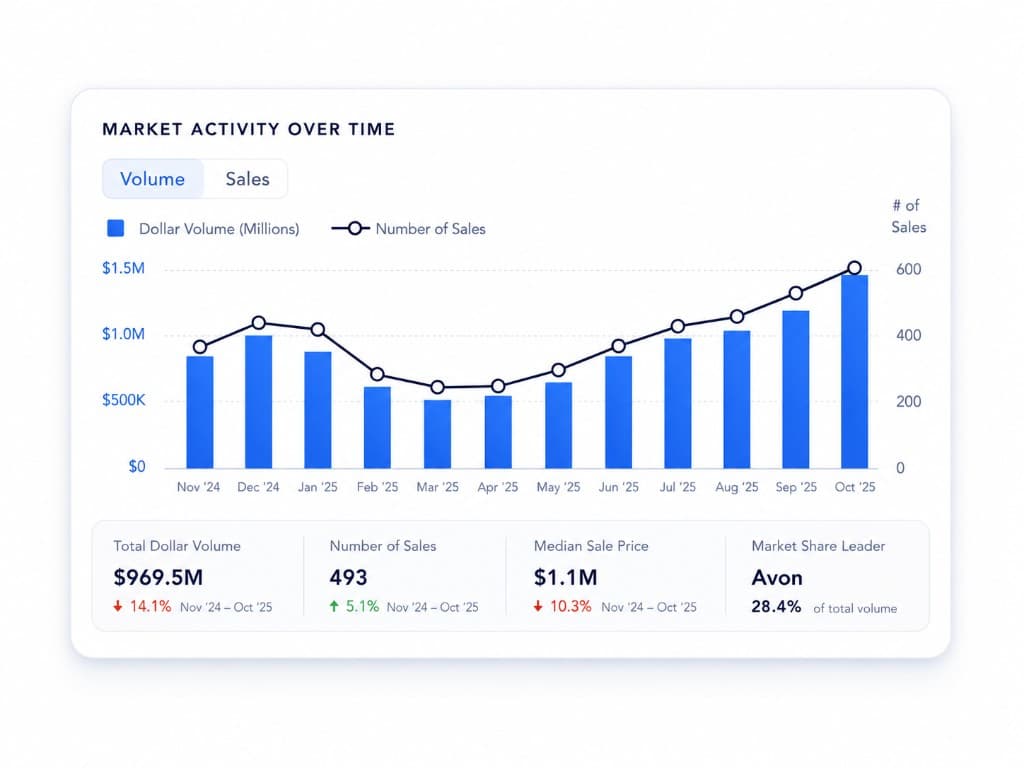
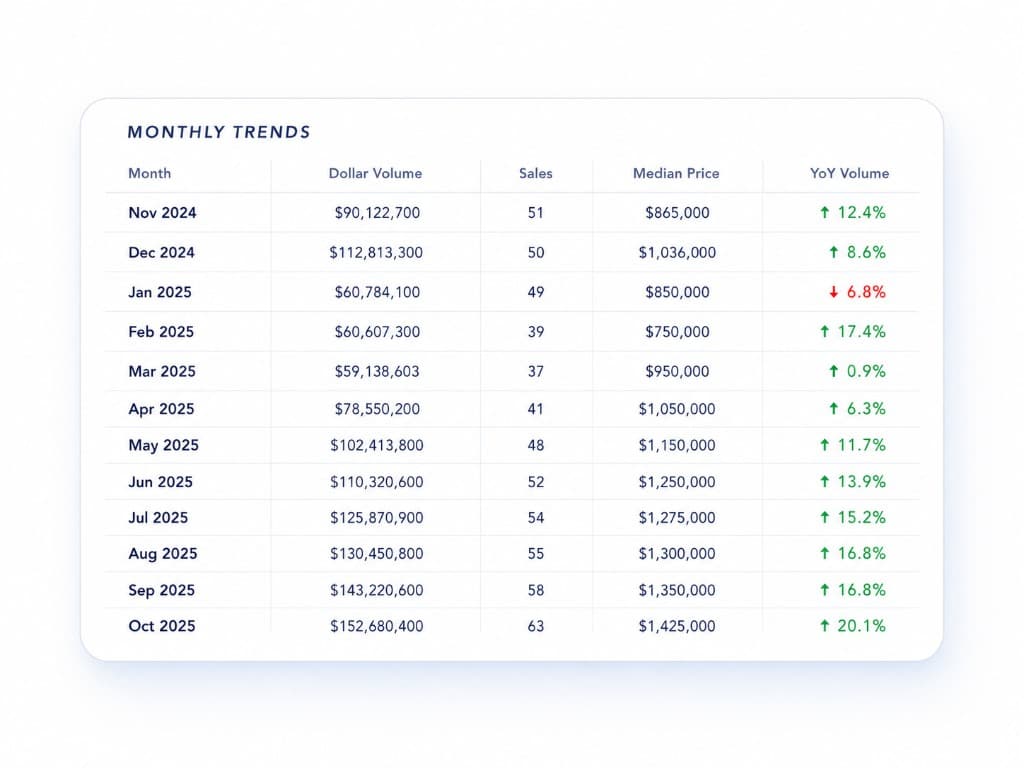
Follow the market as it changes
Review the sales data provided through the platform to see how transaction activity, dollar volume, and pricing are changing over time.
- Review monthly and year-to-date performance
- Compare current results with previous years
- Identify seasonal patterns and meaningful shifts
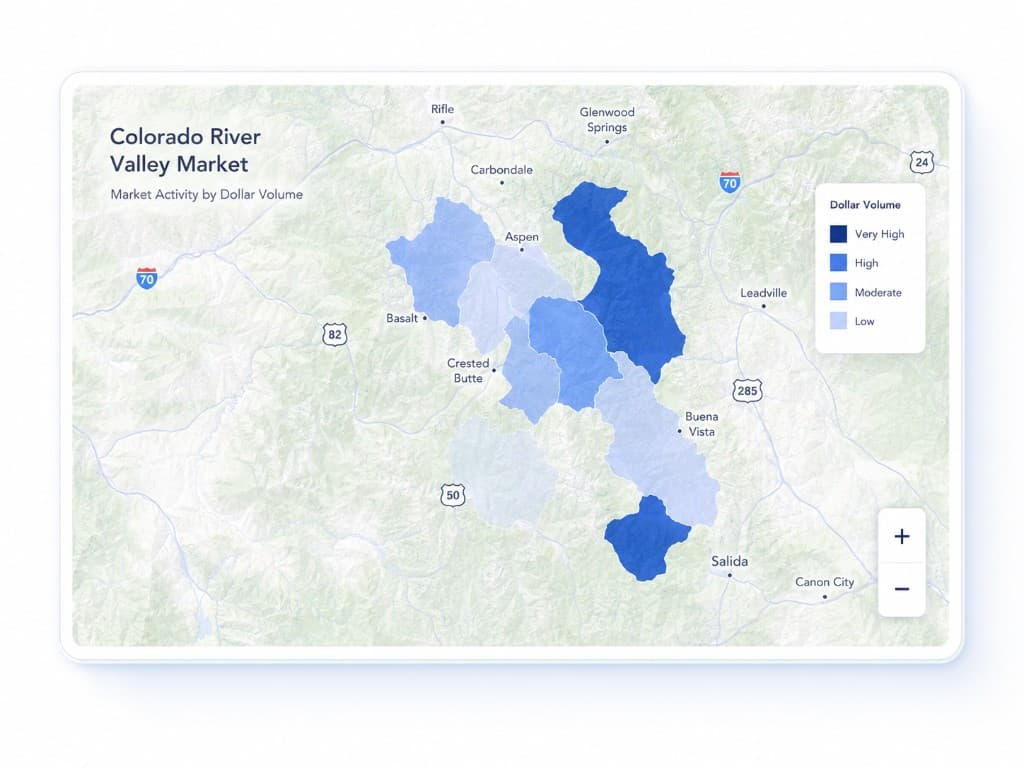
See where market activity is happening
Explore sales geographically and understand which communities are contributing most to current market activity.
- Compare regions, communities, and neighborhoods
- Review individual sales and property details
- Add geographic market context to client reports
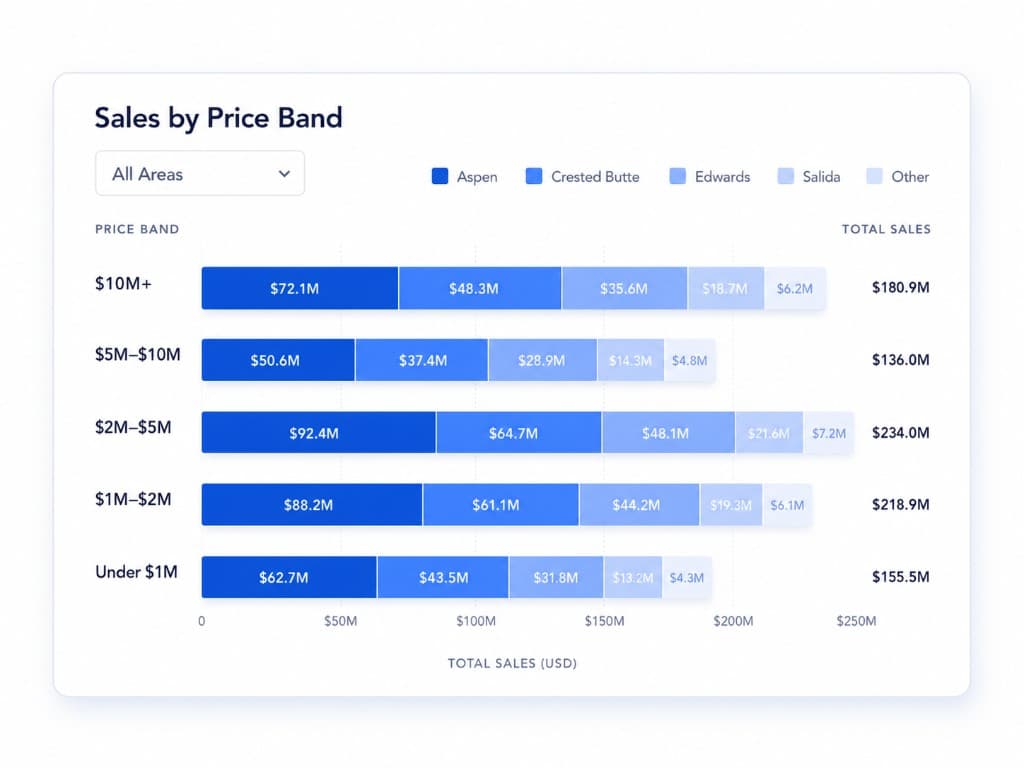
Understand which parts of the market are moving
Analyze sales by price range to see where activity is concentrated and how demand differs across market segments.
- Compare sales and dollar volume by price range
- Identify active and slower-moving segments
- Add current market evidence to pricing conversations
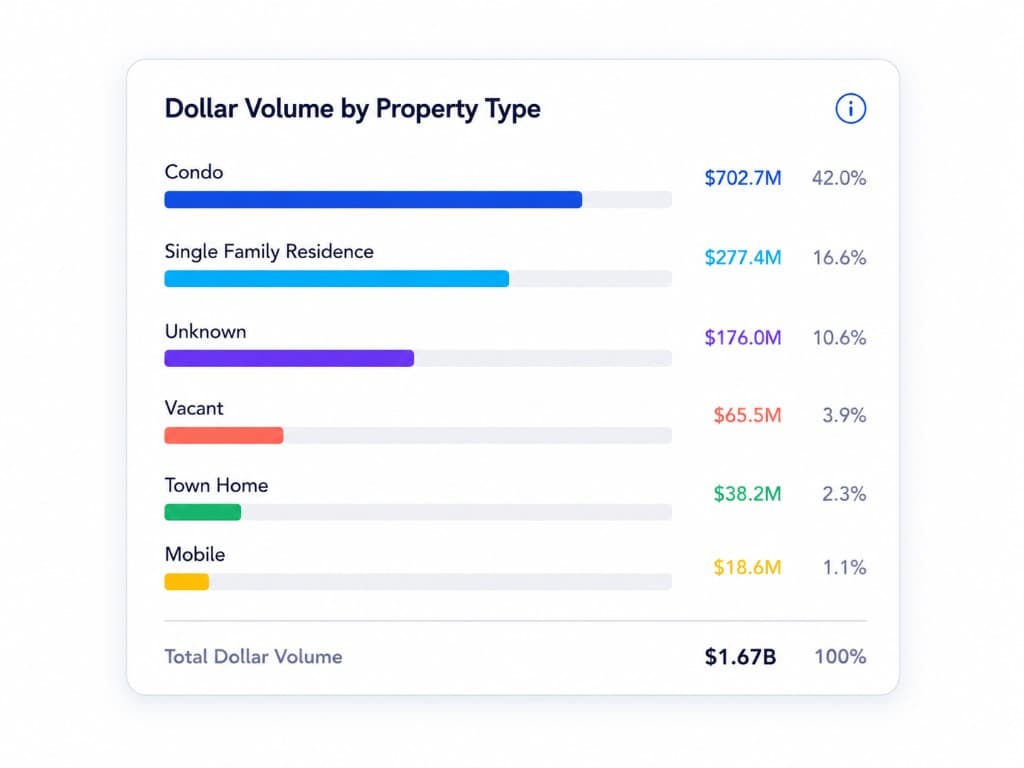
Compare performance by property type
See how single-family homes, condominiums, townhomes, and other property types are performing within the broader market.
- Compare transaction count and dollar volume
- Review pricing and year-over-year performance
- See which property types are gaining or losing market share
Build reports around the questions your clients are asking
Use the report builder to select charts, tables, and market data from across the platform and turn them into a focused, client-ready report.
- Choose from the platform’s charts, maps, and data tables
- Organize each report around a client, area, or market segment
- Save, update, and share reports as the market changes
Built for professionals who need to understand and explain the market
Agents
Access the market data you need for listing presentations, buyer conversations, and regular client updates—without building the analysis from scratch.
Learn moreBrokers and teams
Give your organization a consistent source of market data, analysis, and client-facing reporting.
Learn moreMarket analysts
Work with detailed local data, compare market segments, and turn your findings into clear reports for clients and stakeholders.
Learn moreFrom local market data to a report your clients can use.
Explore the market, choose the insights that matter, and build a clear, professional report—all within Closing Data Research.